EDB: plot nets with Matplotlib#
This example shows how to use the Edb class to view nets, layers and via geometry directly in Python. The methods demonstrated in this example rely on matplotlib.
Perform required imports#
Perform required imports, which includes importing a section.
[1]:
import tempfile

import pyedb
from pyedb.misc.downloads import download_file
Download the EDB and copy it into the temporary folder.#
[2]:
temp_dir = tempfile.TemporaryDirectory(suffix=".ansys")
targetfolder = download_file("edb/ANSYS-HSD_V1.aedb", destination=temp_dir.name)
Create an instance of the Electronics Database using the pyedb.Edb class.#
Note that units are SI.
[3]:
# Select EDB version (change it manually if needed, e.g. "2024.2")
edb_version = "2024.2"
print(f"EDB version: {edb_version}")

edb = pyedb.Edb(edbpath=targetfolder, edbversion=edb_version)
EDB version: 2024.2
PyEDB INFO: StdOut is enabled
PyEDB INFO: Logger is initialized in EDB.
PyEDB INFO: legacy v0.35.dev0
PyEDB INFO: Python version 3.10.11 (tags/v3.10.11:7d4cc5a, Apr  5 2023, 00:38:17) [MSC v.1929 64 bit (AMD64)]
PyEDB INFO: Database ANSYS-HSD_V1.aedb Opened in 2024.2
PyEDB INFO: Cell main Opened
PyEDB INFO: Builder was initialized.
PyEDB INFO: EDB initialized.
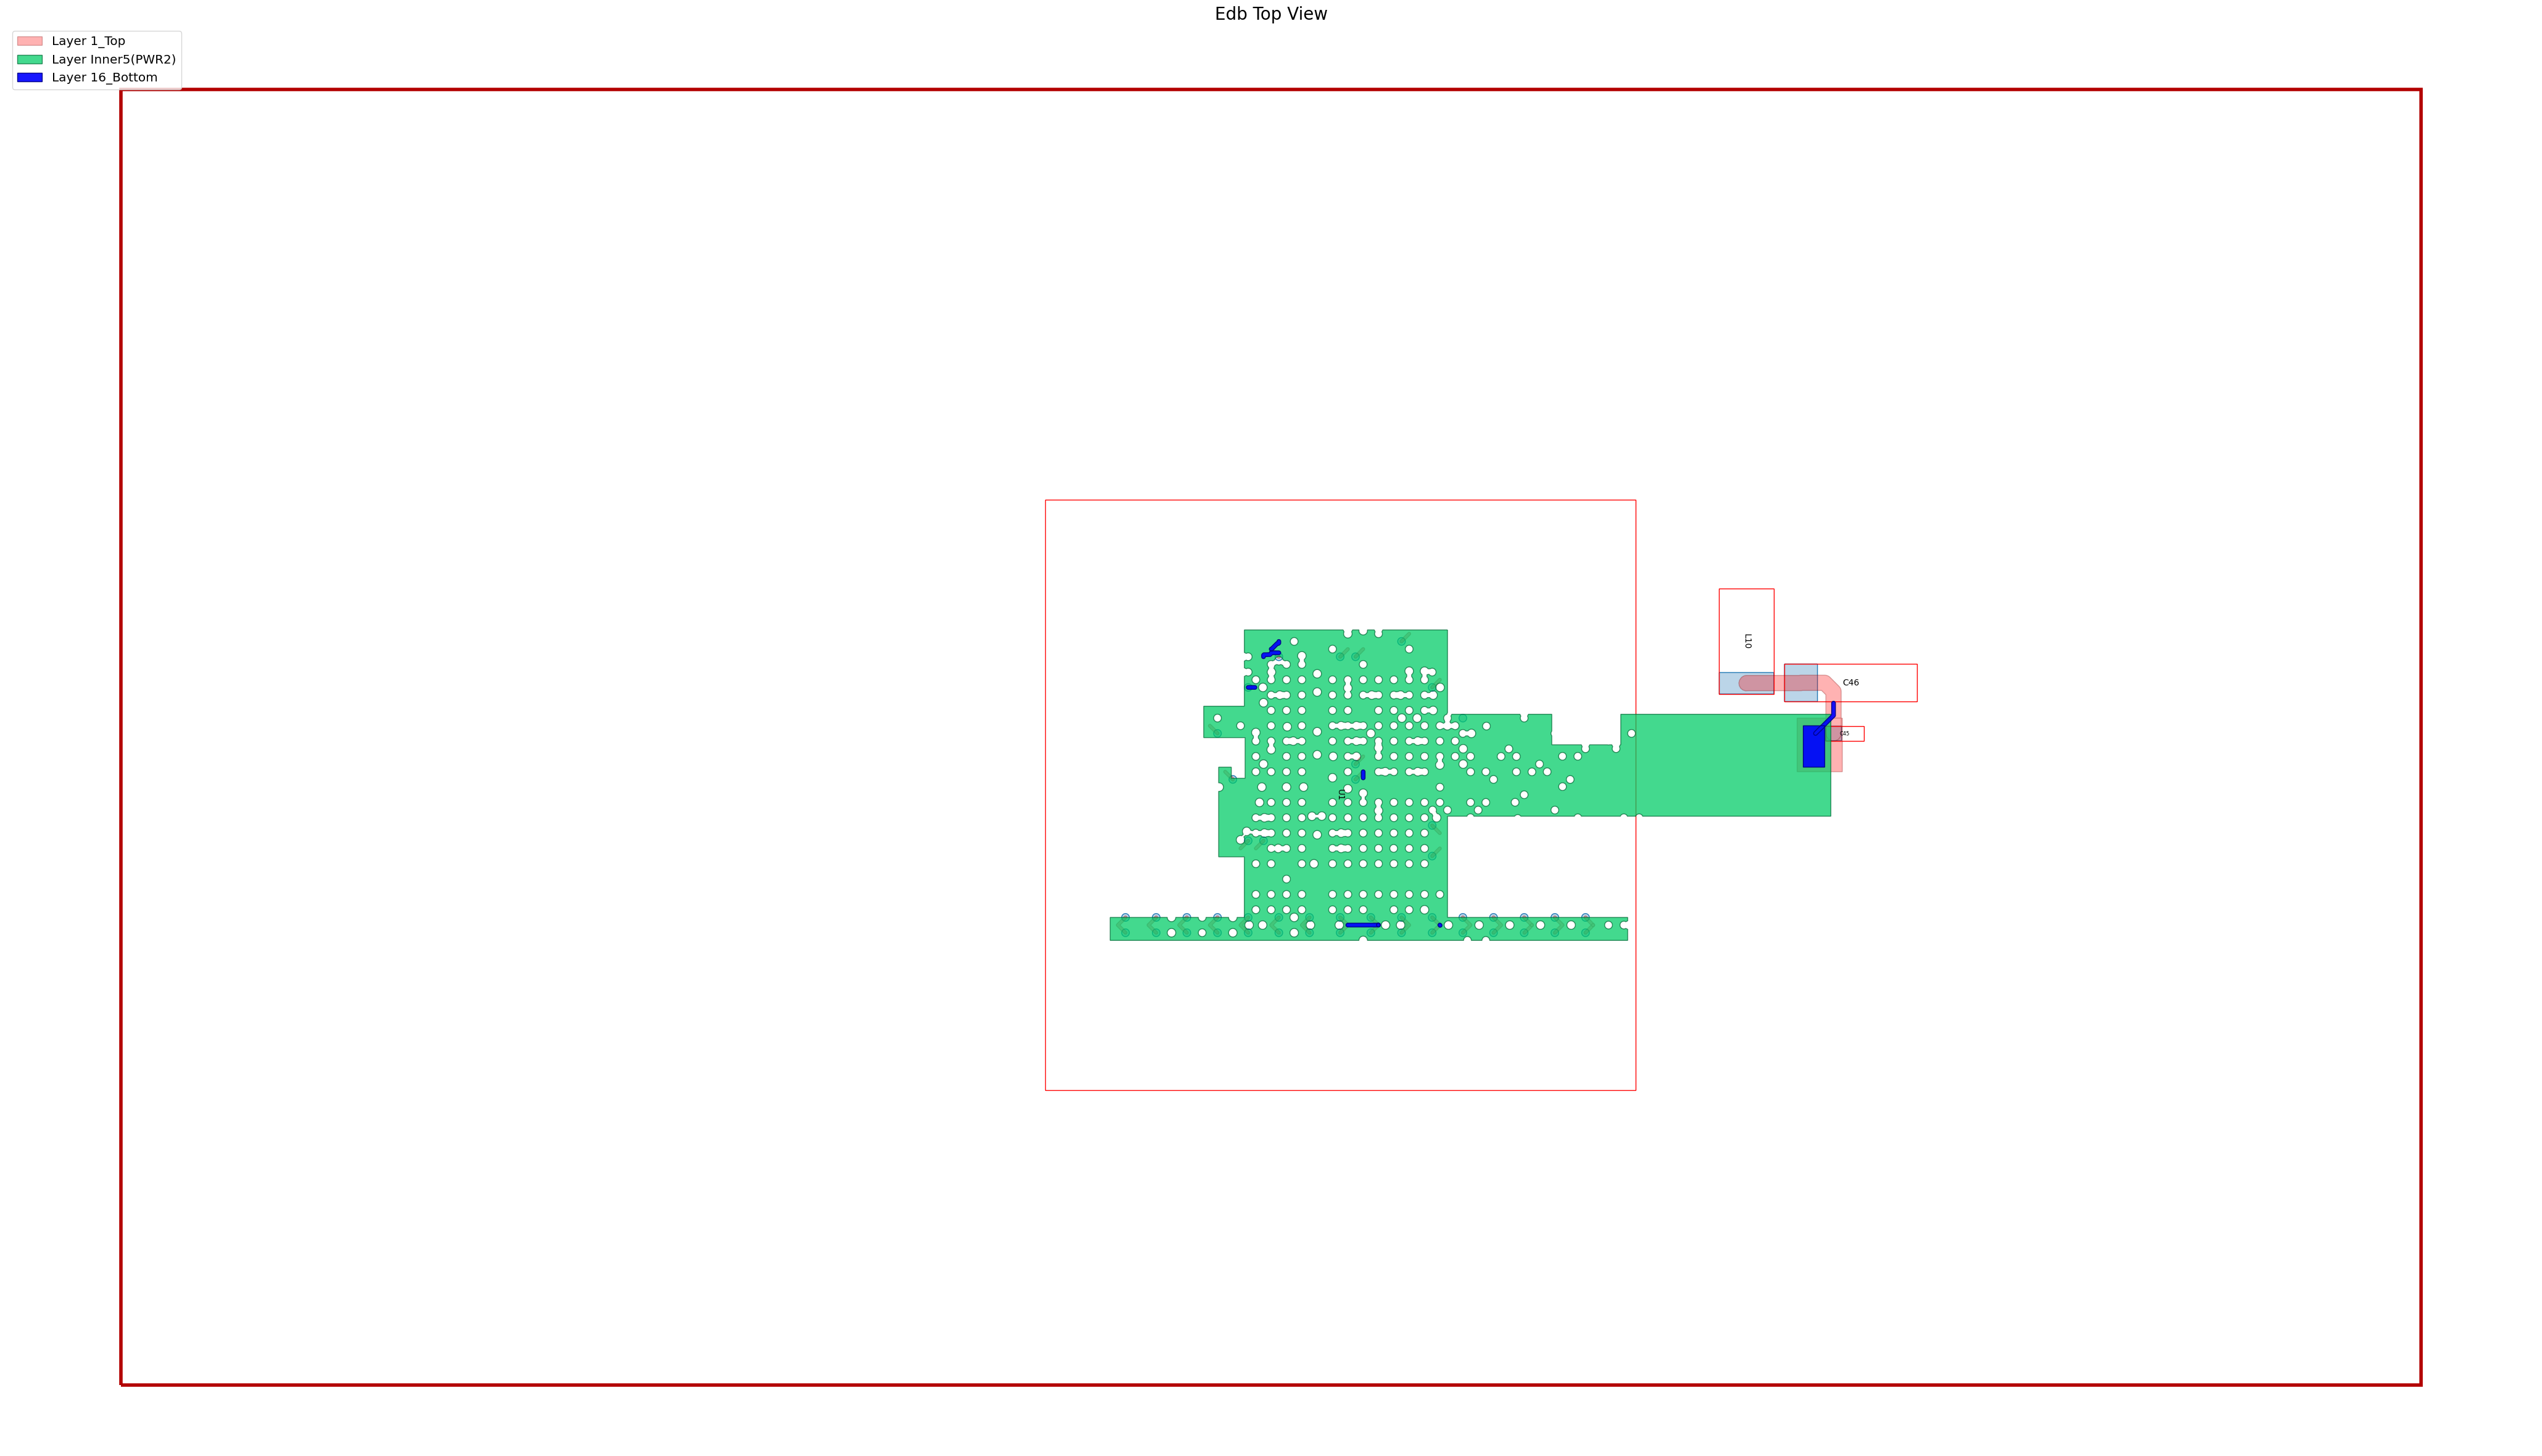
Display the nets on a layer. You can display the net geometry directly in Python using matplotlib from the pyedb.Edb class.
[4]:
edb.nets.plot("AVCC_1V3")
PyEDB INFO: Plot Generation time 5.174
[4]:
(<Figure size 6000x3000 with 1 Axes>, <Axes: title={'center': 'Edb Top View'}>)

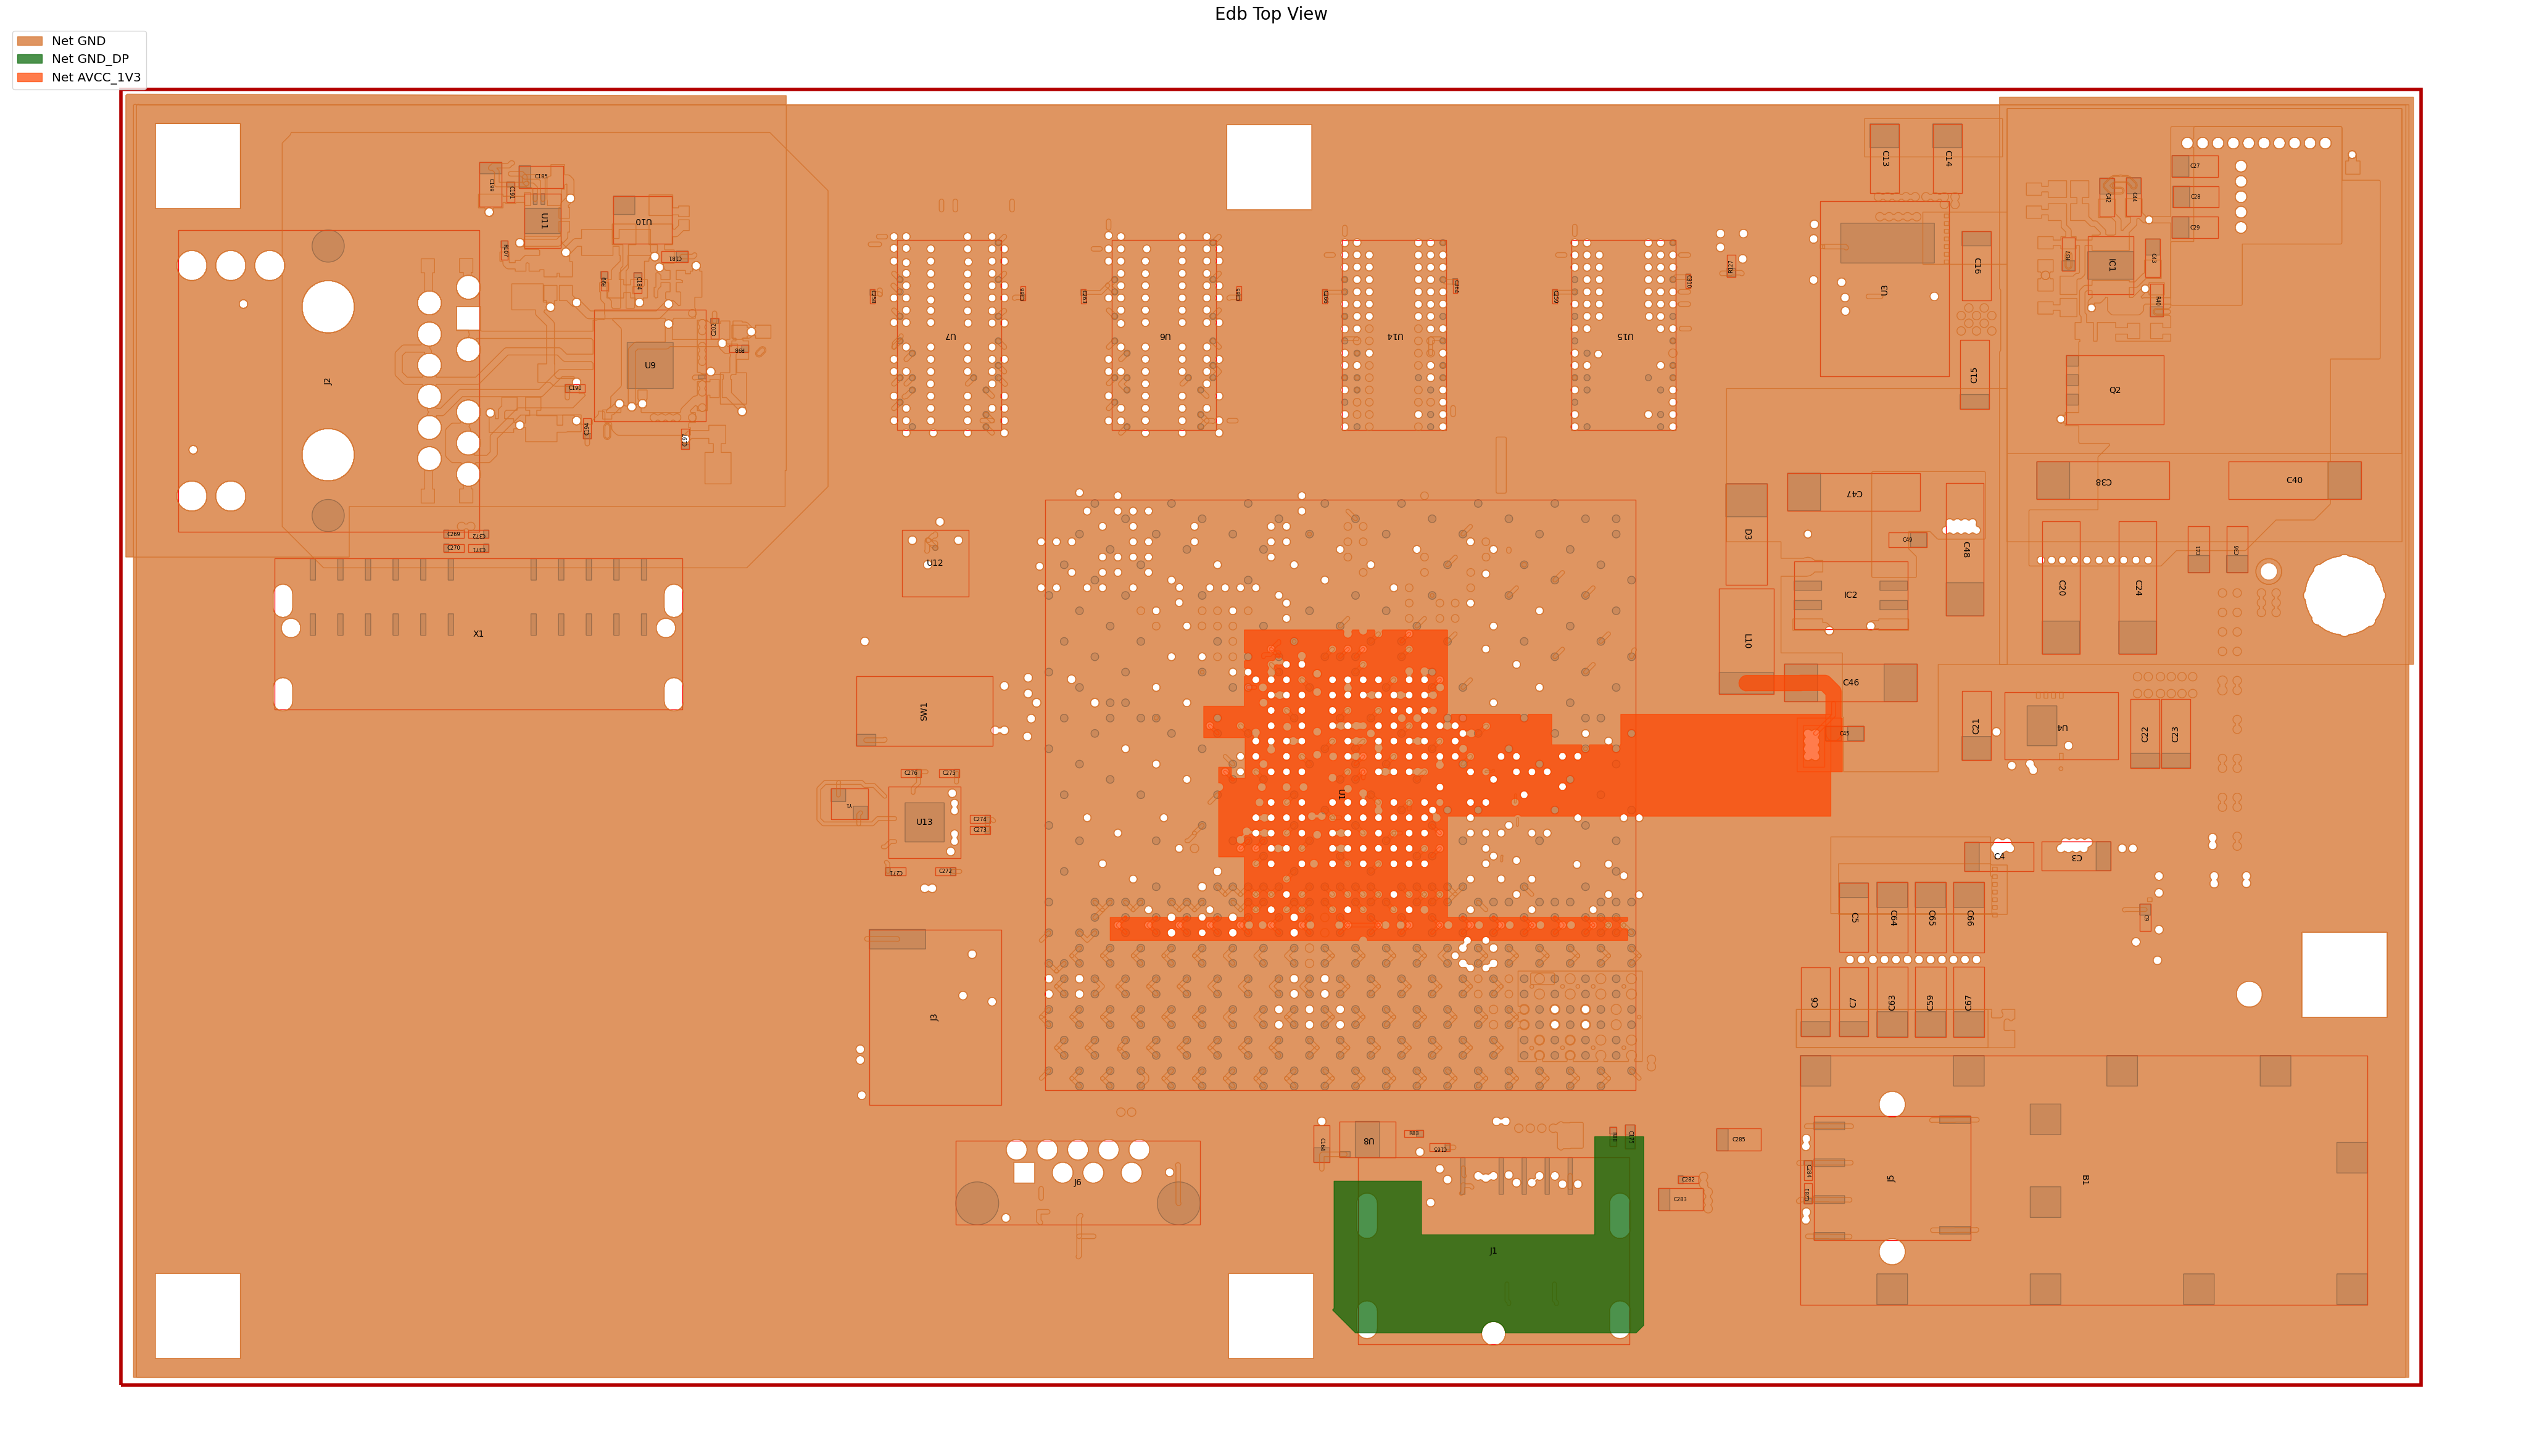
You can view multiple nets by passing a list containing the net names to the plot() method.
[5]:
edb.nets.plot(["GND", "GND_DP", "AVCC_1V3"], color_by_net=True)
PyEDB INFO: Plot Generation time 7.767
[5]:
(<Figure size 6000x3000 with 1 Axes>, <Axes: title={'center': 'Edb Top View'}>)

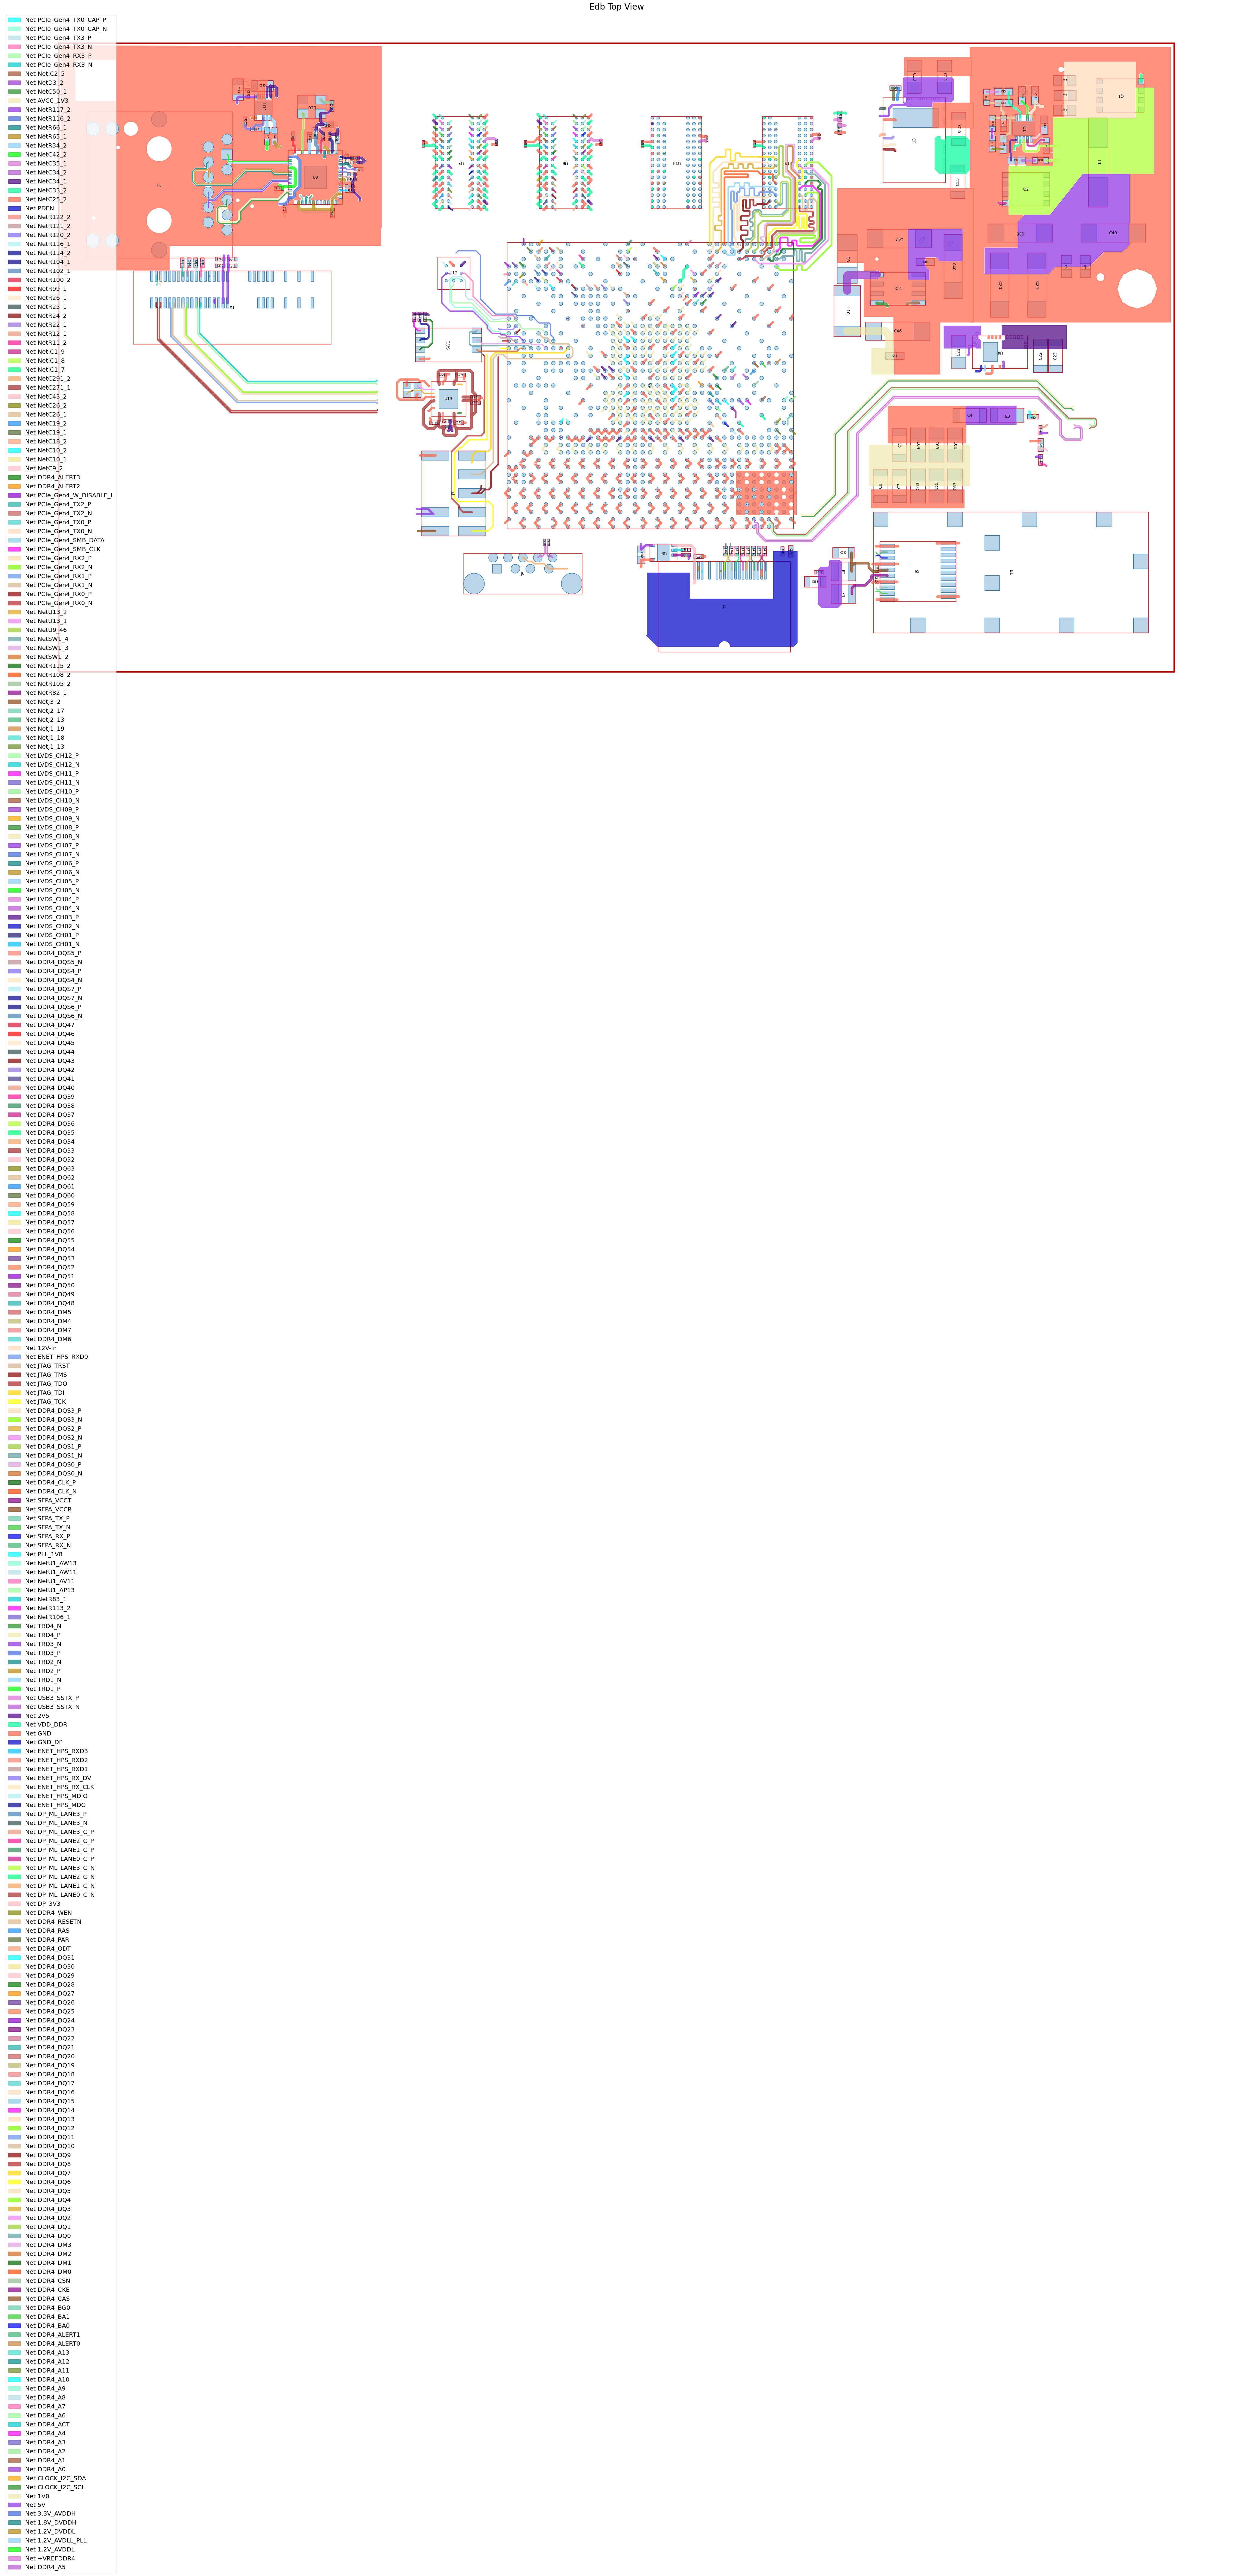
You can display all copper on a single layer by passing None as the first argument. The second argument is a list of layers to plot. In this case, only one layer is to be displayed.
[6]:
edb.nets.plot(None, ["1_Top"], color_by_net=True, plot_components_on_top=True)
PyEDB INFO: Plot Generation time 12.957
[6]:
(<Figure size 6000x3000 with 1 Axes>, <Axes: title={'center': 'Edb Top View'}>)

Display a side view of the layers and padstack geometry using the Edb.stackup.plot() method.
[7]:
edb.stackup.plot(scale_elevation=False, plot_definitions=["c100hn140", "c35"])
C:\actions-runner\_work\pyedb\pyedb\.venv\lib\site-packages\pyedb\dotnet\edb_core\stackup.py:2868: UserWarning: FigureCanvasAgg is non-interactive, and thus cannot be shown
  plt.show()
[7]:
<module 'matplotlib.pyplot' from 'C:\\actions-runner\\_work\\pyedb\\pyedb\\.venv\\lib\\site-packages\\matplotlib\\pyplot.py'>
Close the EDB.
[8]:
edb.close_edb()
PyEDB INFO: EDB file release time: 15.57ms
[8]:
True
Remove all files and the temporary directory.
[9]:
temp_dir.cleanup()
